import sys
from collections import Counter

import pandas as pd
from IPython.display import display

sys.path.insert(0, "..")
from utils import pull_target_intel, top_counts, style_table, chart, set_dark_chart_style
Sources observed attacking VulnCheck canaries in VulnCheck Target Intelligence.
CLASSIFICATION = "canary-attacker"
LABEL = "Canary Attacker"
MAX_PAGES = 25  # cap (2000 records/page); small categories are pulled in full

records, total, complete = pull_target_intel(classifications=CLASSIFICATION, max_pages=MAX_PAGES)

# Sub-type counts tallied from the records (the classifications filter only matches
# the top-level category, so sub-types are counted directly). Exact when fully
# pulled, sample-based otherwise.
prefix = CLASSIFICATION + ":"
counter = Counter()
for r in records:
    for tag in (r.get("classifications") or []):
        if tag.startswith(prefix):
            counter[tag.split(":", 1)[1]] += 1
subtypes = pd.DataFrame(counter.most_common(), columns=["Sub-type", "Host Records"])

scope = "all" if complete else f"sampled {len(records):,} of"
print(f"{LABEL}: {total:,} host records ({scope} pulled) | {len(subtypes)} entries")
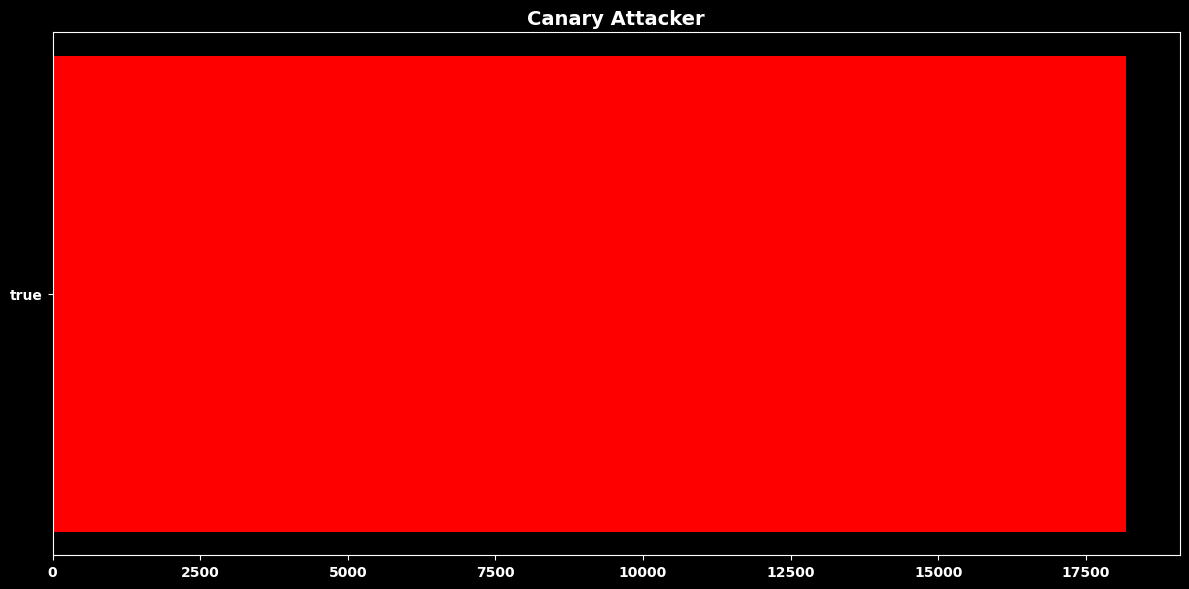
Canary Attacker: 18,186 host records (all pulled) | 1 entries
set_dark_chart_style()display(style_table(subtypes.rename(columns={"Sub-type": LABEL})))
chart(list(subtypes.head(10)[["Sub-type", "Host Records"]].itertuples(index=False, name=None)),
f"{LABEL}", "red")Loading...
Top Countries
chart(top_counts(records, "country"), "Top Countries", "#feba46")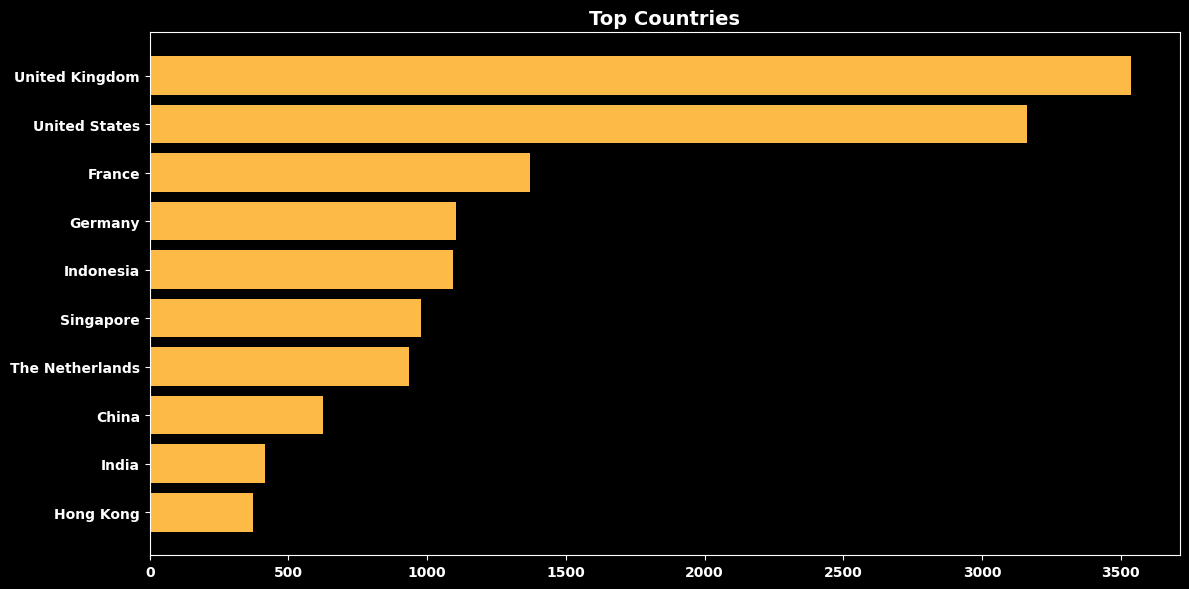
Top Ports
chart([(str(p), c) for p, c in top_counts(records, "port")], "Top Ports", "#9c9ae3")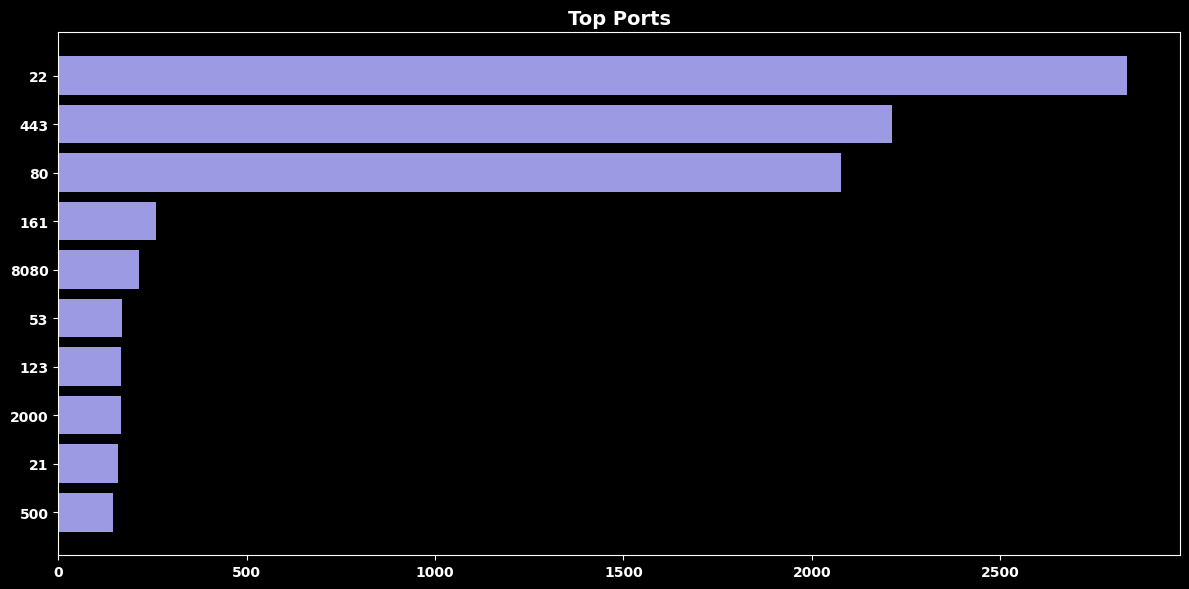
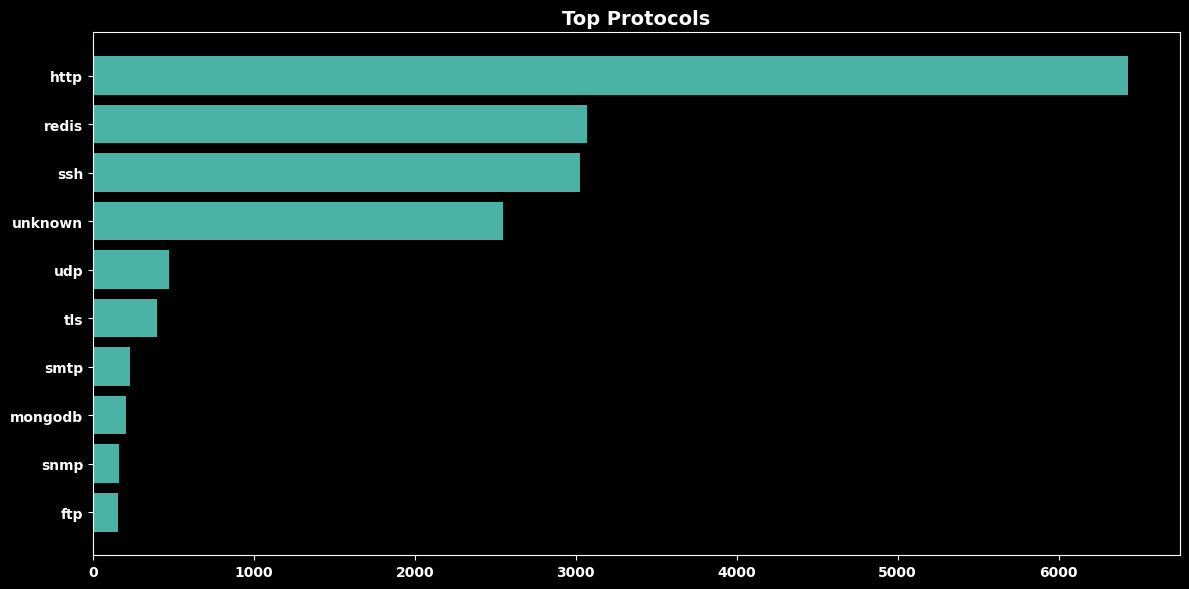
Top Protocols
chart(top_counts(records, "protocol"), "Top Protocols", "#4bb3a5")