Initial Configuration
import os
import vulncheck_sdk
import matplotlib.pyplot as plt
import pandas as pd
import plotly.express as px
import calplot
from dotenv import load_dotenv

load_dotenv()

DEFAULT_HOST = "https://api.vulncheck.com"
DEFAULT_API = DEFAULT_HOST + "/v3"
TOKEN = os.environ["VULNCHECK_API_TOKEN"]
YEAR = 2025

# Configure the VulnCheck API client
configuration = vulncheck_sdk.Configuration(host=DEFAULT_API)
configuration.api_key["Bearer"] = TOKEN
Pull Data
import sys
import pandas as pd

sys.path.insert(0, "..")
from utils import load_df

raw = load_df("vulncheck-canaries3d")
df_original = raw[["src_ip", "src_port", "src_country", "cve", "signature", "category"]].rename(columns={
    "src_ip":       "Source IP",
    "src_port":     "Source Port",
    "src_country":  "Source Country",
    "cve":          "CVE",
    "signature":    "Signature",
    "category":     "Category",
})
VulnCheck Canary Intelligence provides exploitation data from globally deployed vulnerable hosts revealing the first signs of vulnerability exploitation and tracking which CVEs are being targeted in the wild, and by whom.
Canary Detections by Country
# Count source countries and create DataFrame
country_counts = df_original['Source Country'].fillna('Unknown').value_counts()
country_counts_df = (
    country_counts.rename_axis('Source Country')
    .reset_index(name='Count')
    .sort_values('Count', ascending=False)
)

# Set up dark mode for the plot
plt.style.use('dark_background')
plt.figure(figsize=(12, 6))

# Create bar plot
plt.bar(range(len(country_counts_df.head(15))),
        country_counts_df['Count'].head(15),
        color='red')

# Customize x-axis with bold labels
plt.xticks(range(len(country_counts_df.head(15))),
          country_counts_df['Source Country'].head(15),
          rotation=45,
          ha='right',
          color='white',
          fontweight='bold')

# Customize y-axis and labels
plt.ylabel('Detection Count', color='white', fontweight='bold')
for label in plt.gca().yaxis.get_ticklabels():
    label.set_fontweight('bold')
plt.tick_params(axis='y', colors='white', labelsize=10)

# Add title
plt.title('Top 15 Source Countries by Detection Count',
          color='white',
          fontweight='bold',
          pad=20)

# Set background color
plt.gca().set_facecolor('black')

# Adjust layout
plt.tight_layout()
plt.show()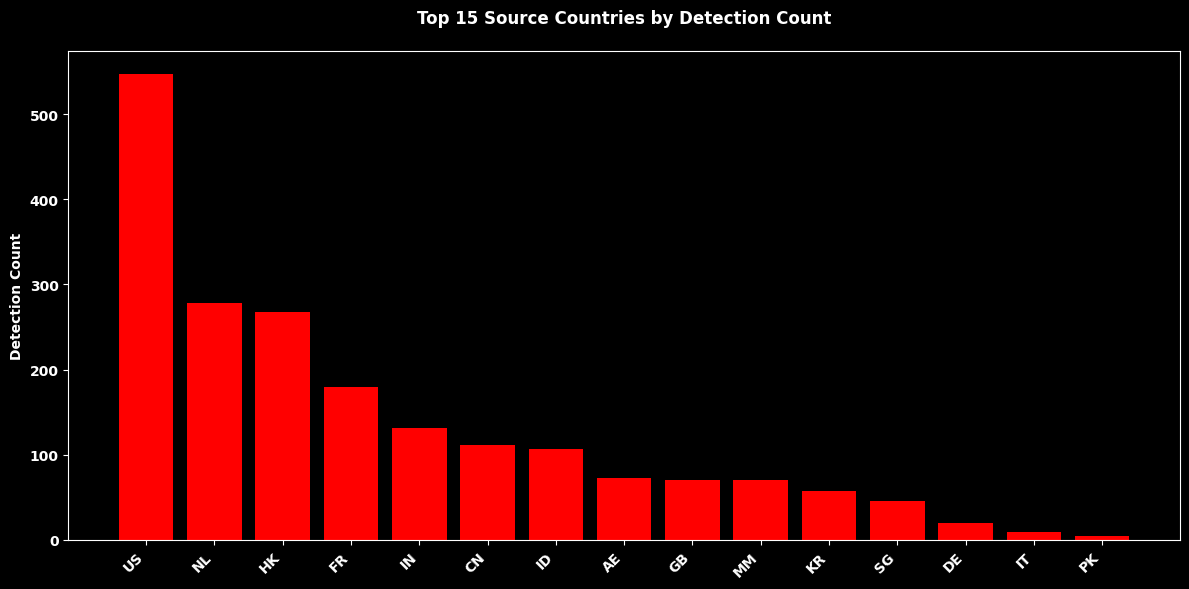
Top 15 CVEs by Canary Exploitation Activity
# Normalize CVE column to lists, treating missing as 'Unknown'
def to_list(x):
    if pd.isna(x):
        return ['Unknown']
    if isinstance(x, list):
        return x if len(x) > 0 else ['Unknown']
    if isinstance(x, str) and ',' in x:
        return [item.strip() for item in x.split(',') if item.strip()] or ['Unknown']
    return [x]

cve_series = df_original['CVE'].apply(to_list).explode()
cve_counts = cve_series.fillna('Unknown').value_counts()

# Create DataFrame with counts
cve_counts_df = (
    cve_counts.rename_axis('CVE')
    .reset_index(name='Count')
    .sort_values('Count', ascending=False)
)

# Set up dark mode for the plot
plt.style.use('dark_background')
plt.figure(figsize=(14, 7))

# Create bar plot
plt.bar(range(len(cve_counts_df.head(15))),
        cve_counts_df['Count'].head(15),
        color='red')

# Customize x-axis with vertical bold labels
plt.xticks(range(len(cve_counts_df.head(15))),
          cve_counts_df['CVE'].head(15),
          rotation=90,
          ha='center',
          color='white',
          fontweight='bold')

# Customize y-axis and labels
plt.ylabel('Detection Count', color='white', fontweight='bold')
for label in plt.gca().yaxis.get_ticklabels():
    label.set_fontweight('bold')
plt.tick_params(axis='y', colors='white', labelsize=10)

# Add title
plt.title('Top 15 CVEs by Detection Count',
          color='white',
          fontweight='bold',
          pad=20)

# Set background color
plt.gca().set_facecolor('black')

# Adjust layout to prevent label cutoff
plt.tight_layout()
plt.show()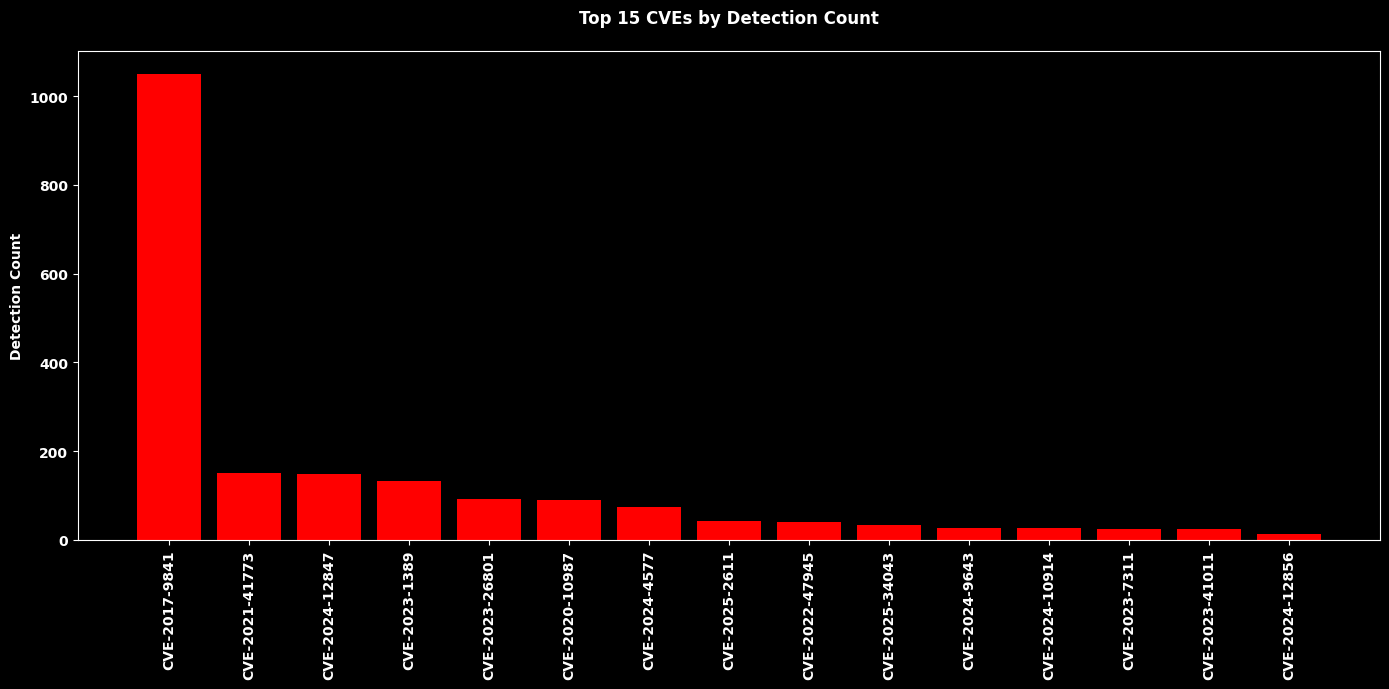
Top Source IPs Detected by VulnCheck Canaries
The top 5 source IP addresses observed exploiting VulnCheck Canaries.
# Top 5 source IP addresses by occurrence (styled table similar to stats)
ip_counts = df_original['Source IP'].fillna('Unknown').value_counts()
ip_counts_df = (
    ip_counts.rename_axis('Source IP')
    .reset_index(name='Count')
    .sort_values('Count', ascending=False)
)
top_n = 5

# Prepare the top-N DataFrame
top_df = ip_counts_df.head(top_n).copy()
top_df['Count'] = top_df['Count'].astype(int)

# Try to use pandas Styler (match the style used in the provided snippet). If unavailable, fall back to HTML.
from IPython.display import display, HTML
try:
    styled = (
        top_df.style
        .set_properties(**{'text-align': 'center'})
        .set_table_styles([{'selector': 'th', 'props': [('text-align', 'center')]}])
        .set_table_attributes('style="width:50%; border-collapse: collapse;"')
        .hide(axis='index')
        .format({'Count': '{:,}'})
    )
    display(styled)
except Exception as e:
    # Fallback: render HTML table without index and inject CSS
    html_table = top_df.to_html(index=False, classes="styled-table", escape=False)
    css = (
        "<style>"
        ".styled-table{background-color:#000000;color:#ffffff;border-collapse:collapse;width:50%;font-family:Arial,Helvetica,sans-serif;}"
        ".styled-table th, .styled-table td{padding:8px 12px;border:none;text-align:center;vertical-align:middle;}"
        ".styled-table th{background-color:#0b0b0b;}"
        "</style>"
    )
    html = css + html_table
    display(HTML(html))
Loading...