Initial Configuration
import os
import vulncheck_sdk
import pandas as pd
import numpy as np
import matplotlib.pyplot as plt

from collections import Counter, defaultdict
from dotenv import load_dotenv

load_dotenv()

DEFAULT_HOST = "https://api.vulncheck.com"
DEFAULT_API = DEFAULT_HOST + "/v3"
TOKEN = os.environ["VULNCHECK_API_TOKEN"]
YEAR = 2025

# Configure the VulnCheck API client
configuration = vulncheck_sdk.Configuration(host=DEFAULT_API)
configuration.api_key["Bearer"] = TOKEN
Pull Data
with vulncheck_sdk.ApiClient(configuration) as api_client:
    indices_client = vulncheck_sdk.IndicesApi(api_client)

    limit = 2000

    # Initialize lists to store IP intel data
    ip = []
    port = []
    country = []
    cve = []
    matches = []
    typeid = []
    typekind = []
    typefinding = []
    hostnames = []
    feed_ids = []

    # Make the initial request to start pagination
    api_response = indices_client.index_ipintel10d_get(start_cursor="true", limit=limit)

    # Process the first page of results
    for entry in api_response.data:
        ip.append(getattr(entry, "ip", None))
        port.append(getattr(entry, "port", None))
        country.append(getattr(entry, "country", None))

        # CVE
        cve_list = getattr(entry, "cve", None)
        if isinstance(cve_list, list):
            cve.append(cve_list)
        elif cve_list is not None:
            cve.append([cve_list])
        else:
            cve.append([])

        # Matches  <--- NEW BLOCK
        match_list = getattr(entry, "matches", None)
        if isinstance(match_list, list):
            matches.append(match_list)
        elif match_list is not None:
            matches.append([match_list])
        else:
            matches.append([])

        # Hostnames
        hostname_list = getattr(entry, "hostnames", None)
        if isinstance(hostname_list, list):
            hostnames.append(hostname_list)
        elif hostname_list is not None:
            hostnames.append([hostname_list])
        else:
            hostnames.append([])

        # Feed IDs
        feed_list = getattr(entry, "feed_ids", None)
        if isinstance(feed_list, list):
            feed_ids.append(feed_list)
        elif feed_list is not None:
            feed_ids.append([feed_list])
        else:
            feed_ids.append([])

        typeid.append(getattr(getattr(entry, "type", None), "id", None))
        typekind.append(getattr(getattr(entry, "type", None), "kind", None))
        typefinding.append(getattr(getattr(entry, "type", None), "finding", None))

    # Continue fetching data while there's a next cursor
    while api_response.meta.next_cursor is not None:

        api_response = indices_client.index_ipintel10d_get(
            cursor=api_response.meta.next_cursor, limit=limit
        )

        for entry in api_response.data:
            ip.append(getattr(entry, "ip", None))
            port.append(getattr(entry, "port", None))
            country.append(getattr(entry, "country", None))

            # CVE
            cve_list = getattr(entry, "cve", None)
            if isinstance(cve_list, list):
                cve.append(cve_list)
            elif cve_list is not None:
                cve.append([cve_list])
            else:
                cve.append([])

            # Matches  <--- NEW BLOCK
            match_list = getattr(entry, "matches", None)
            if isinstance(match_list, list):
                matches.append(match_list)
            elif match_list is not None:
                matches.append([match_list])
            else:
                matches.append([])

            # Hostnames
            hostname_list = getattr(entry, "hostnames", None)
            if isinstance(hostname_list, list):
                hostnames.append(hostname_list)
            elif hostname_list is not None:
                hostnames.append([hostname_list])
            else:
                hostnames.append([])

            # Feed IDs
            feed_list = getattr(entry, "feed_ids", None)
            if isinstance(feed_list, list):
                feed_ids.append(feed_list)
            elif feed_list is not None:
                feed_ids.append([feed_list])
            else:
                feed_ids.append([])

            typeid.append(getattr(getattr(entry, "type", None), "id", None))
            typekind.append(getattr(getattr(entry, "type", None), "kind", None))
            typefinding.append(getattr(getattr(entry, "type", None), "finding", None))

# Create a DataFrame from the accumulated data
df_original = pd.DataFrame({
    'IP': ip,
    'Port': port,
    'Country': country,
    'CVE': cve,
    'Matches': matches,
    'Hostnames': hostnames,
    'Feed IDs': feed_ids,
    'Type ID': typeid,
    'Type Kind': typekind,
    'Type Finding': typefinding
})

# Expand CVEs into separate rows
df_original = df_original.explode('CVE', ignore_index=True)

print(df_original)
                       IP   Port      Country             CVE  \
0         161.118.206.188  53632    Singapore  CVE-2022-47945
1         161.118.206.188  53632    Singapore   CVE-2017-9841
2         161.118.206.188  53632    Singapore   CVE-2017-9841
3         161.118.206.188  53632    Singapore   CVE-2017-9841
4         161.118.206.188  53632    Singapore   CVE-2017-9841
...                   ...    ...          ...             ...
12651263     54.64.89.132    443        Japan  CVE-2023-38951
12651264     54.64.89.132    443        Japan  CVE-2023-38952
12651265   121.175.77.245    465  South Korea  CVE-2023-38950
12651266   121.175.77.245    465  South Korea  CVE-2023-38951
12651267   121.175.77.245    465  South Korea  CVE-2023-38952

                                                    Matches  \
0         [VULNCHECK CVE-2022-47945 ThinkPHP Exploit Att...
1         [VULNCHECK PHPUnit CVE-2017-9841 Exploit Attempt]
2         [VULNCHECK PHPUnit CVE-2017-9841 Exploit Attempt]
3         [VULNCHECK PHPUnit CVE-2017-9841 Exploit Attempt]
4         [VULNCHECK PHPUnit CVE-2017-9841 Exploit Attempt]
...                                                     ...
12651263  [ZKTeco BioTime Path Traversal, ZKTeco BioTime...
12651264  [ZKTeco BioTime Path Traversal, ZKTeco BioTime...
12651265  [ZKTeco BioTime Path Traversal, ZKTeco BioTime...
12651266  [ZKTeco BioTime Path Traversal, ZKTeco BioTime...
12651267  [ZKTeco BioTime Path Traversal, ZKTeco BioTime...

                                                  Hostnames  \
0                                                        []
1                                                        []
2                                                        []
3                                                        []
4                                                        []
...                                                     ...
12651263  [ec2-54-64-89-132.ap-northeast-1.compute.amazo...
12651264  [ec2-54-64-89-132.ap-northeast-1.compute.amazo...
12651265                                                 []
12651266                                                 []
12651267                                                 []

                                                   Feed IDs  \
0                                         [635298565431427]
1                                         [635298565431427]
2                                         [635298565431427]
3                                         [635298565431427]
4                                         [635298565431427]
...                                                     ...
12651263  [f51ad2be-ff5b-426a-8657-3a30dc4e2b74, a39638c...
12651264  [f51ad2be-ff5b-426a-8657-3a30dc4e2b74, a39638c...
12651265  [f51ad2be-ff5b-426a-8657-3a30dc4e2b74, a39638c...
12651266  [f51ad2be-ff5b-426a-8657-3a30dc4e2b74, a39638c...
12651267  [f51ad2be-ff5b-426a-8657-3a30dc4e2b74, a39638c...

                     Type ID Type Kind            Type Finding
0         vulncheck-canaries            Web Application Attack
1         vulncheck-canaries            Web Application Attack
2         vulncheck-canaries            Web Application Attack
3         vulncheck-canaries            Web Application Attack
4         vulncheck-canaries            Web Application Attack
...                      ...       ...                     ...
12651263      initial-access            potentially vulnerable
12651264      initial-access            potentially vulnerable
12651265      initial-access            potentially vulnerable
12651266      initial-access            potentially vulnerable
12651267      initial-access            potentially vulnerable

[12651268 rows x 10 columns]
VulnCheck IP Intelligence includes tracking of potentially vulnerable systems that may be targeted by initial access exploits as well as tracking of command & control (C2) attacker infrastructure and honeypots.
Top 15 Command & Control (C2) / Attacker Infrastructure
# --- Filter for Type ID = "c2" ---
df_c2 = df_original[df_original["Type ID"] == "c2"]

# Drop rows without Matches
df_c2 = df_c2.dropna(subset=["Matches"])

# --- Deduplicate by unique IP ---
df_unique = df_c2.drop_duplicates(subset=["IP"])

# --- Flatten list-type Matches ---
flat_matches = []
for m in df_unique["Matches"]:
    if isinstance(m, list):
        flat_matches.extend(m)
    elif pd.notna(m):
        flat_matches.append(m)

# --- Count and get top 25 ---
match_counts = pd.Series(Counter(flat_matches)).sort_values(ascending=False).head(15)

# Truncate labels to 15 chars
labels = [str(m)[:15] + ("…" if len(str(m)) > 15 else "") for m in match_counts.index]

# --- Dark mode ---
plt.style.use("dark_background")

plt.rcParams['font.weight'] = 'bold'
plt.rcParams['axes.labelweight'] = 'bold'
plt.rcParams['axes.titleweight'] = 'bold'

plt.figure(figsize=(14, 7))

plt.bar(labels, match_counts.values, color="red")

plt.xticks(rotation=90, color="white", fontweight="bold")
plt.xlabel("C2 / Attacker Infrastructure", color="white", fontweight="bold")
plt.ylabel("Number of Unique C2 IPs", color="white", fontweight="bold")
plt.title("Top 15 C2 Infrastructure by Unique IP Count", color="white", fontweight="bold")

plt.tight_layout()
plt.show()

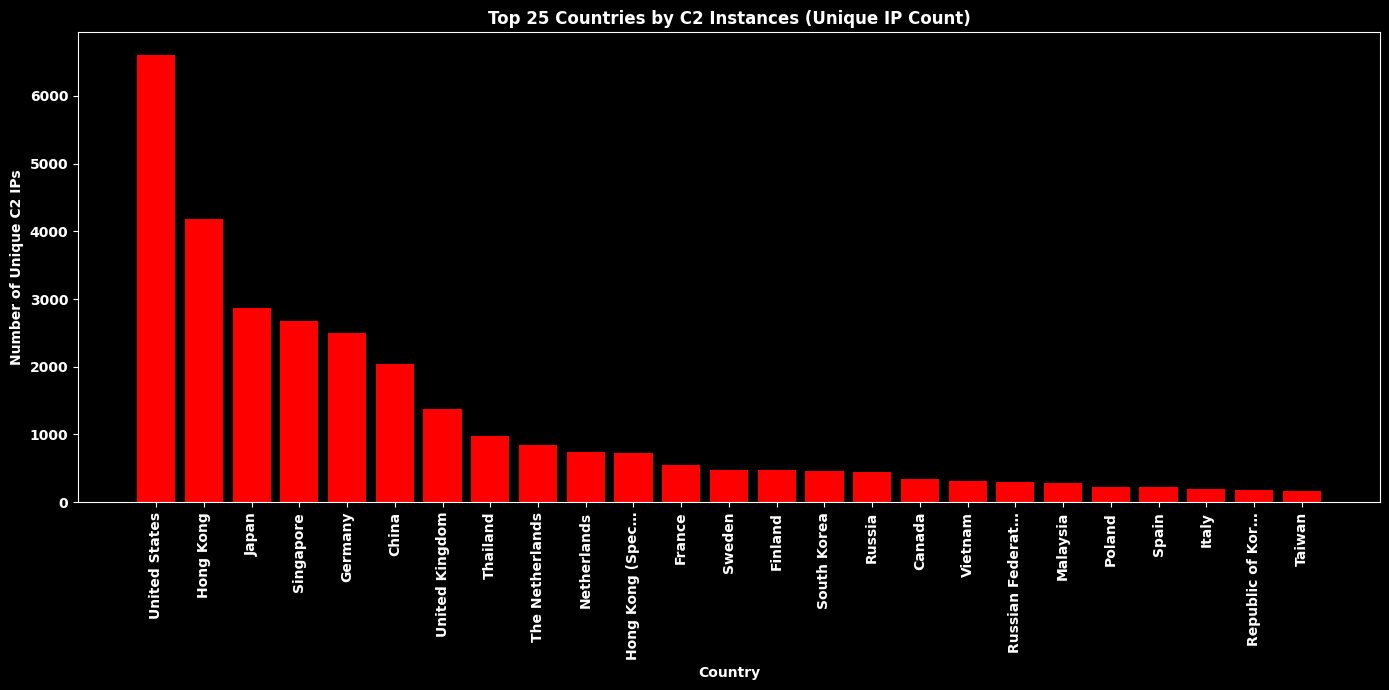
Top 25 Countries by Command and Control (C2) Instances
# --- Filter for Type ID = "c2" ---
df_c2 = df_original[df_original["Type ID"] == "c2"]

# Drop missing countries
df_c2 = df_c2.dropna(subset=["Country"])

# --- Deduplicate by unique IP ---
df_unique = df_c2.drop_duplicates(subset=["IP"])

# Count and get top 25
country_counts = df_unique["Country"].value_counts().head(25)

# Truncate labels to 15 chars
labels = [c[:15] + ("…" if len(c) > 15 else "") for c in country_counts.index]

# --- Dark mode ---
plt.style.use("dark_background")

# --- Global bold settings ---
plt.rcParams['font.weight'] = 'bold'
plt.rcParams['axes.labelweight'] = 'bold'
plt.rcParams['axes.titleweight'] = 'bold'

plt.figure(figsize=(14, 7))

# --- Red bars explicitly ---
plt.bar(labels, country_counts.values, color="red")

plt.xticks(rotation=90, color="white", fontweight="bold")
plt.xlabel("Country", color="white", fontweight="bold")
plt.ylabel("Number of Unique C2 IPs", color="white", fontweight="bold")
plt.title("Top 25 Countries by C2 Instances (Unique IP Count)", color="white", fontweight="bold")

plt.tight_layout()
plt.show()
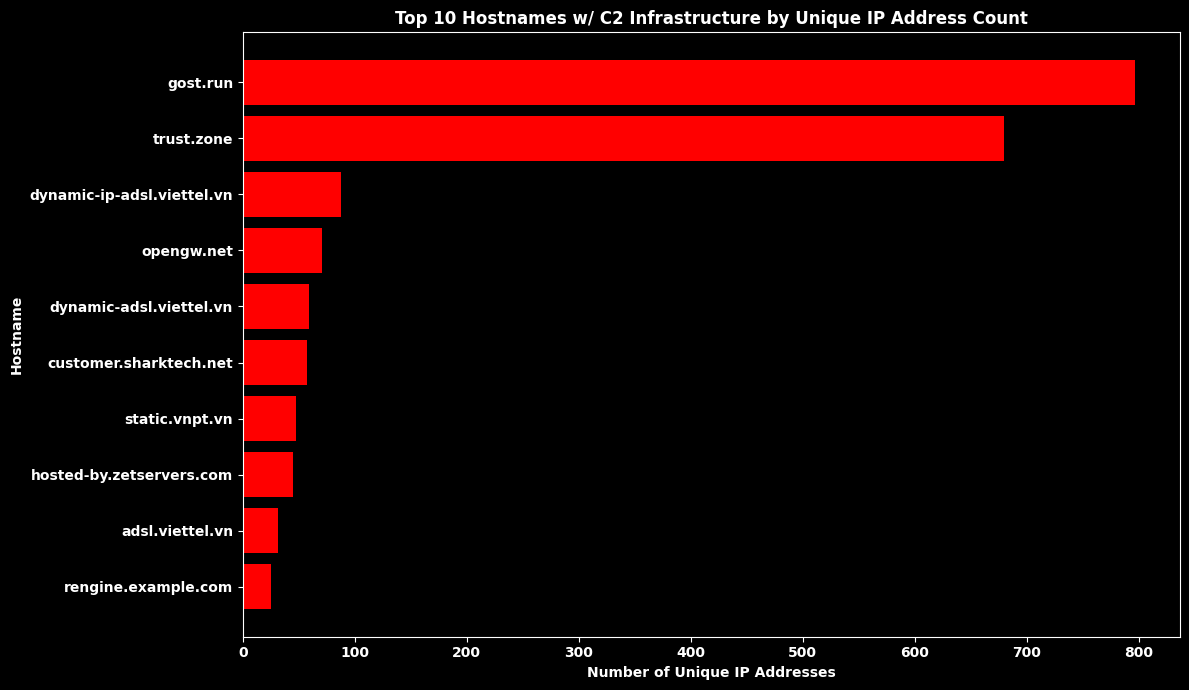
Top 10 Hostnames w/ Command & Control Infrastructure
# --- Filter for Type ID = "c2" ---
df_c2 = df_original[df_original["Type ID"] == "c2"]

# --- Drop completely missing Hostnames ---
df_host = df_c2.dropna(subset=["Hostnames"])

# --- Deduplicate to count each IP only once per hostname ---
hostname_ip_map = defaultdict(set)

for _, row in df_host.iterrows():
    ip = row["IP"]
    hostnames = row["Hostnames"]

    # --- Skip rows with missing IP or empty/invalid hostnames ---
    if (
        ip is None
        or (isinstance(ip, float) and pd.isna(ip))
        or hostnames is None
        or (isinstance(hostnames, float) and pd.isna(hostnames))
        or (isinstance(hostnames, (list, np.ndarray)) and len(hostnames) == 0)
    ):
        continue

    # --- Handle list or single hostname ---
    if isinstance(hostnames, (list, np.ndarray)):
        for h in hostnames:
            if pd.notna(h):
                hostname_ip_map[str(h)].add(ip)
    else:
        hostname_ip_map[str(hostnames)].add(ip)

# --- Convert mapping to DataFrame ---
hostname_counts = pd.DataFrame(
    [(hostname, len(ips)) for hostname, ips in hostname_ip_map.items()],
    columns=["Hostname", "Unique IP Count"]
).sort_values("Unique IP Count", ascending=False).head(10)

# --- Dark mode style ---
plt.style.use("dark_background")

# --- Global bold settings ---
plt.rcParams['font.weight'] = 'bold'
plt.rcParams['axes.labelweight'] = 'bold'
plt.rcParams['axes.titleweight'] = 'bold'

plt.figure(figsize=(12, 7))

# --- Horizontal bar chart ---
plt.barh(
    hostname_counts["Hostname"].astype(str),
    hostname_counts["Unique IP Count"],
    color="red"
)

plt.gca().invert_yaxis()  # Highest values at top
plt.yticks(color="white", fontweight="bold")
plt.xticks(color="white", fontweight="bold")
plt.xlabel("Number of Unique IP Addresses", color="white", fontweight="bold")
plt.ylabel("Hostname", color="white", fontweight="bold")
plt.title(
    "Top 10 Hostnames w/ C2 Infrastructure by Unique IP Address Count",
    color="white",
    fontweight="bold"
)

plt.tight_layout()
plt.show()
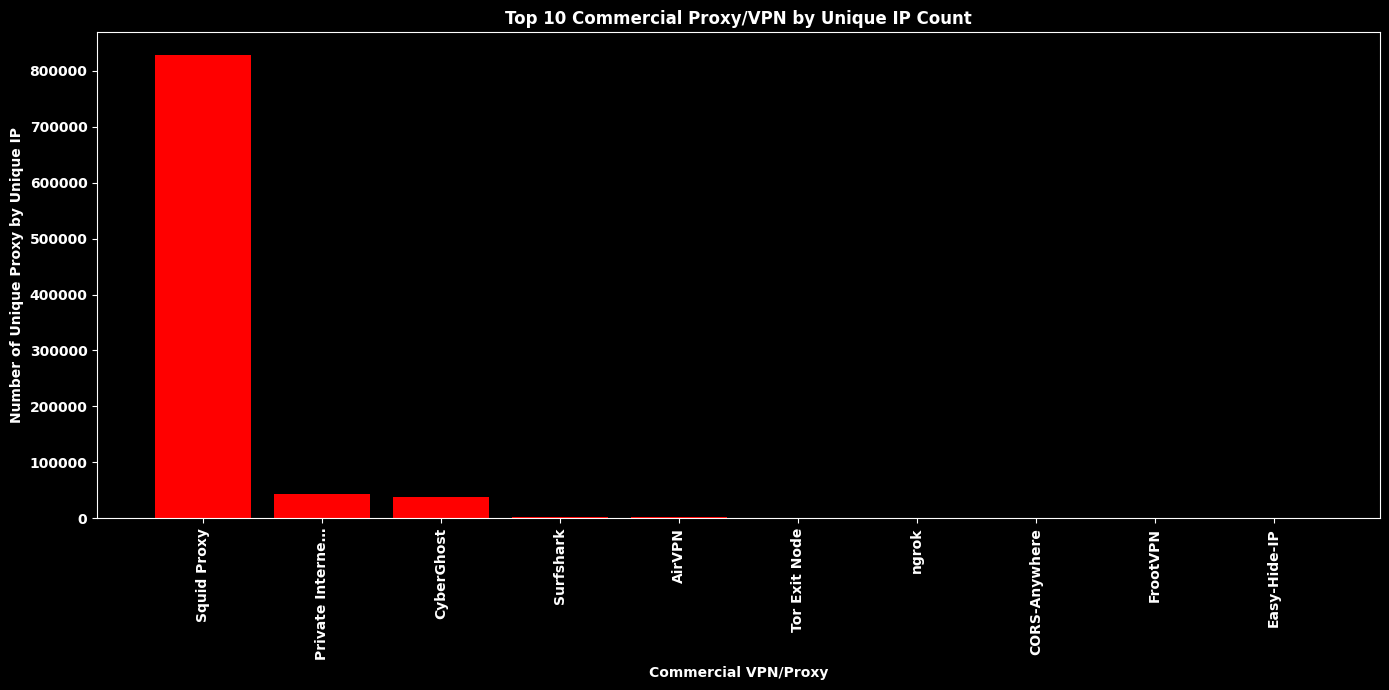
Top 10 Commercial Proxy/VPN by Unique IP Count
# --- Filter for Type ID = "proxy" ---
df_proxy = df_original[df_original["Type ID"] == "proxy"]

# Drop rows without Matches
df_proxy = df_proxy.dropna(subset=["Matches"])

# --- Deduplicate by unique IP ---
df_unique = df_proxy.drop_duplicates(subset=["IP"])

# --- Flatten list-type Matches ---
flat_matches = []
for m in df_unique["Matches"]:
    if isinstance(m, list):
        flat_matches.extend(m)
    elif pd.notna(m):
        flat_matches.append(m)

# --- Count and get top 10 ---
match_counts = pd.Series(Counter(flat_matches)).sort_values(ascending=False).head(10)

# Truncate labels to 15 chars for readability
labels = [str(m)[:15] + ("…" if len(str(m)) > 15 else "") for m in match_counts.index]

# --- Dark mode style ---
plt.style.use("dark_background")

# --- Global bold settings ---
plt.rcParams['font.weight'] = 'bold'
plt.rcParams['axes.labelweight'] = 'bold'
plt.rcParams['axes.titleweight'] = 'bold'

plt.figure(figsize=(14, 7))

# --- Red bars explicitly ---
plt.bar(labels, match_counts.values, color="red")

plt.xticks(rotation=90, color="white", fontweight="bold")
plt.xlabel("Commercial VPN/Proxy", color="white", fontweight="bold")
plt.ylabel("Number of Unique Proxy by Unique IP", color="white", fontweight="bold")
plt.title("Top 10 Commercial Proxy/VPN by Unique IP Count", color="white", fontweight="bold")

plt.tight_layout()
plt.show()
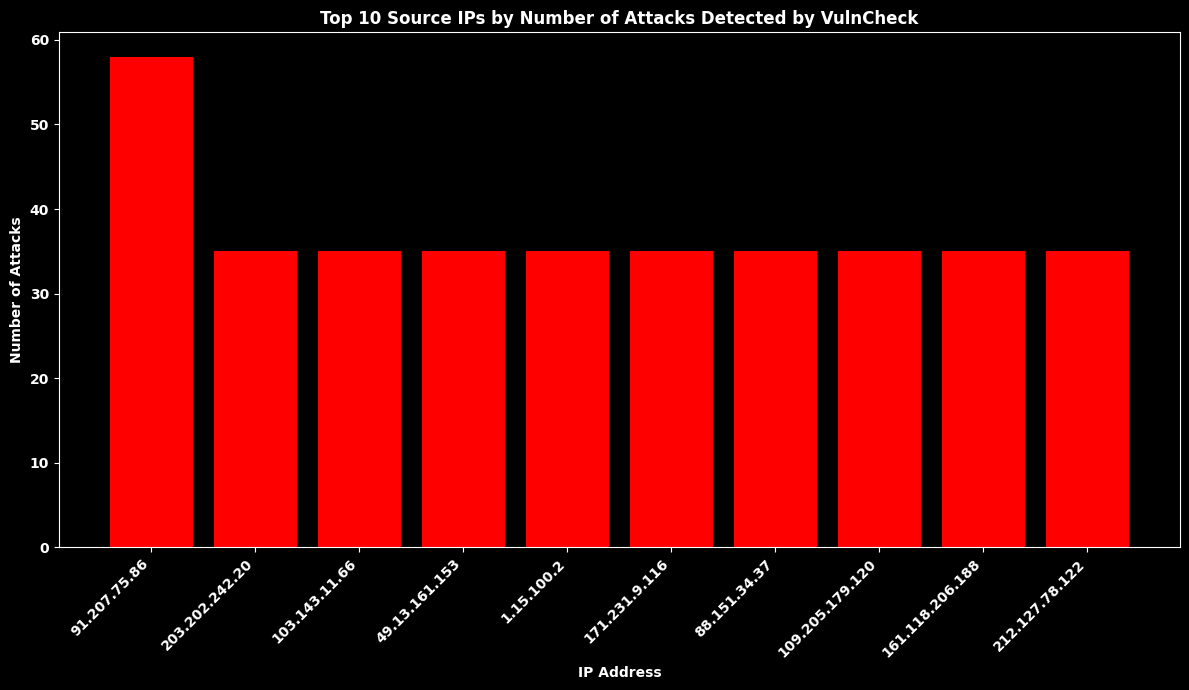
Top 10 Source IPs by Number of Attacks Detected by VulnCheck Canaries
# --- Normalize and filter for Type ID = "vulncheck-canaries" ---
df_canaries = df_original[
    df_original["Type ID"].astype(str).str.strip().str.lower() == "vulncheck-canaries"
]

# --- Drop missing IPs ---
df_canaries = df_canaries.dropna(subset=["IP"])

# --- Check if data exists ---
if df_canaries.empty:
    print("⚠️ No records found for Type ID = 'vulncheck-canaries'")
else:
    # --- Count top 10 IPs ---
    ip_counts = df_canaries["IP"].value_counts().head(10)

    # --- Dark mode style ---
    plt.style.use("dark_background")

    # --- Global bold settings ---
    plt.rcParams['font.weight'] = 'bold'
    plt.rcParams['axes.labelweight'] = 'bold'
    plt.rcParams['axes.titleweight'] = 'bold'

    plt.figure(figsize=(12, 7))

    # --- Vertical bar chart ---
    plt.bar(ip_counts.index.astype(str), ip_counts.values, color="red")

    # --- Formatting ---
    plt.xticks(rotation=45, ha="right", color="white", fontweight="bold")
    plt.yticks(color="white", fontweight="bold")
    plt.xlabel("IP Address", color="white", fontweight="bold")
    plt.ylabel("Number of Attacks", color="white", fontweight="bold")
    plt.title(
        "Top 10 Source IPs by Number of Attacks Detected by VulnCheck",
        color="white",
        fontweight="bold"
    )

    plt.tight_layout()
    plt.show()
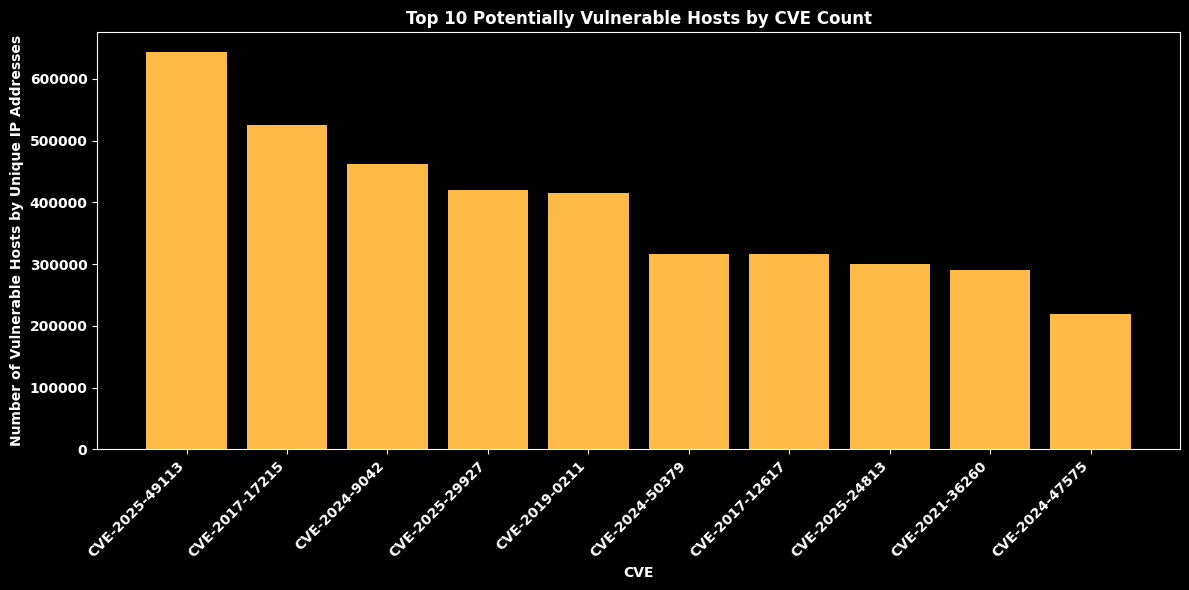
Top 10 Vulnerabilities by Potentially Vulnerable Hosts
# --- Drop missing CVEs ---
df_cve = df_original.dropna(subset=["CVE"])

# --- Deduplicate to count each IP only once per CVE ---
cve_ip_map = defaultdict(set)

for _, row in df_cve.iterrows():
    ip = row["IP"]
    cves = row["CVE"]

    if pd.isna(ip) or pd.isna(cves):
        continue

    # Handle lists or single values
    if isinstance(cves, list):
        for cve in cves:
            if pd.notna(cve):
                cve_ip_map[cve].add(ip)
    else:
        cve_ip_map[cves].add(ip)

# --- Convert mapping to DataFrame ---
cve_counts = pd.DataFrame(
    [(cve, len(ips)) for cve, ips in cve_ip_map.items()],
    columns=["CVE", "Unique IP Count"]
).sort_values("Unique IP Count", ascending=False).head(10)

# --- Dark mode style ---
plt.style.use("dark_background")

# --- Global bold settings ---
plt.rcParams['font.weight'] = 'bold'
plt.rcParams['axes.labelweight'] = 'bold'
plt.rcParams['axes.titleweight'] = 'bold'

plt.figure(figsize=(12, 6))

# --- Blue bars (for CVE chart) ---
plt.bar(cve_counts["CVE"].astype(str), cve_counts["Unique IP Count"], color="#feba46")

plt.xticks(rotation=45, ha="right", color="white", fontweight="bold")
plt.xlabel("CVE", color="white", fontweight="bold")
plt.ylabel("Number of Vulnerable Hosts by Unique IP Addresses", color="white", fontweight="bold")
plt.title("Top 10 Potentially Vulnerable Hosts by CVE Count", color="white", fontweight="bold")

plt.tight_layout()
plt.show()
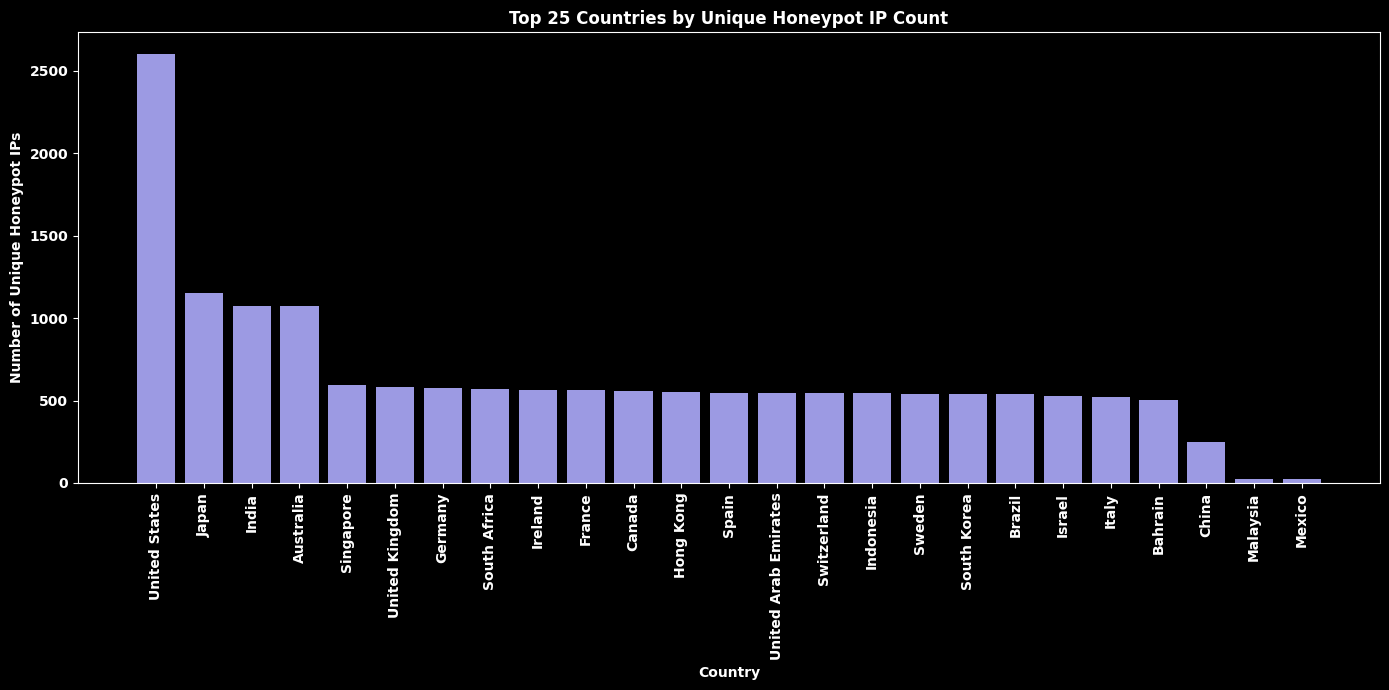
Top 25 Countries by Honeypot Count
# --- Filter for Type ID = "honeypot" ---
df_honeypot = df_original[df_original["Type ID"] == "honeypot"]

# Drop missing countries
df_honeypot = df_honeypot.dropna(subset=["Country"])

# --- Deduplicate by unique IP ---
df_unique = df_honeypot.drop_duplicates(subset=["IP"])

# --- Count and get top 25 ---
country_counts = df_unique["Country"].value_counts().head(25)

# --- Dark mode ---
plt.style.use("dark_background")

# --- Global bold settings ---
plt.rcParams['font.weight'] = 'bold'
plt.rcParams['axes.labelweight'] = 'bold'
plt.rcParams['axes.titleweight'] = 'bold'

plt.figure(figsize=(14, 7))

# --- Bars ---
plt.bar(country_counts.index.astype(str), country_counts.values, color="#9c9ae3")

plt.xticks(rotation=90, color="white", fontweight="bold")
plt.xlabel("Country", color="white", fontweight="bold")
plt.ylabel("Number of Unique Honeypot IPs", color="white", fontweight="bold")
plt.title("Top 25 Countries by Unique Honeypot IP Count", color="white", fontweight="bold")

plt.tight_layout()
plt.show()