# ---- CONFIG ----
DF_NAME = "df_final" # change if your DataFrame is named differently
# ---- PREP ----
df_plot = globals()[DF_NAME].copy()
# Ensure date is datetime and derive Year (int)
df_plot["VulnCheck KEV Added Date"] = pd.to_datetime(
df_plot["VulnCheck KEV Added Date"], errors="coerce"
)
df_plot["Year"] = df_plot["VulnCheck KEV Added Date"].dt.year
# Keep only rows where VulnCheck reports ransomware exploitation = True
def is_trueish(v):
if isinstance(v, bool):
return v
if v is None:
return False
return str(v).strip().lower() in {"true", "yes", "y", "1"}
df_plot = df_plot[df_plot["Reported Exploited by Ransomware"].apply(is_trueish)]
# Map CISA Known Ransomware Use -> {Known, Unknown, Unspecified}
def map_cisa_use(v):
if v is None or (isinstance(v, float) and np.isnan(v)):
return "Unspecified"
s = str(v).strip().lower()
if s in {"known", "yes", "true", "used", "y", "1"}:
return "Known"
if s in {"unknown", "no", "false", "n", "0"}:
return "Unknown"
return "Unknown"
# Ensure column exists; if not, create as all Unspecified
if "CISA Known Ransomware Use" not in df_plot.columns:
df_plot["CISA Known Ransomware Use"] = np.nan
df_plot["Stack Category"] = df_plot["CISA Known Ransomware Use"].apply(map_cisa_use)
# Drop rows with no year
df_plot = df_plot.dropna(subset=["Year"])
df_plot["Year"] = df_plot["Year"].astype(int)
# Aggregate counts per Year × Category (consistent order)
cat_order = ["Known", "Unknown", "Unspecified"]
counts = (
df_plot.groupby(["Year", "Stack Category"])
.size()
.unstack(fill_value=0)
.reindex(columns=cat_order, fill_value=0)
.sort_index()
)
# ---- PLOT ----
plt.style.use("dark_background")
fig, ax = plt.subplots(figsize=(12, 6))
# Custom colors for Known, Unknown, Unspecified
colors = ["#0078ae", "#c41230", "#5e9732"]
# Plot with pandas, but onto our axes object
counts.plot(kind="bar", stacked=True, ax=ax, color=colors)
# Title / axis labels (bold)
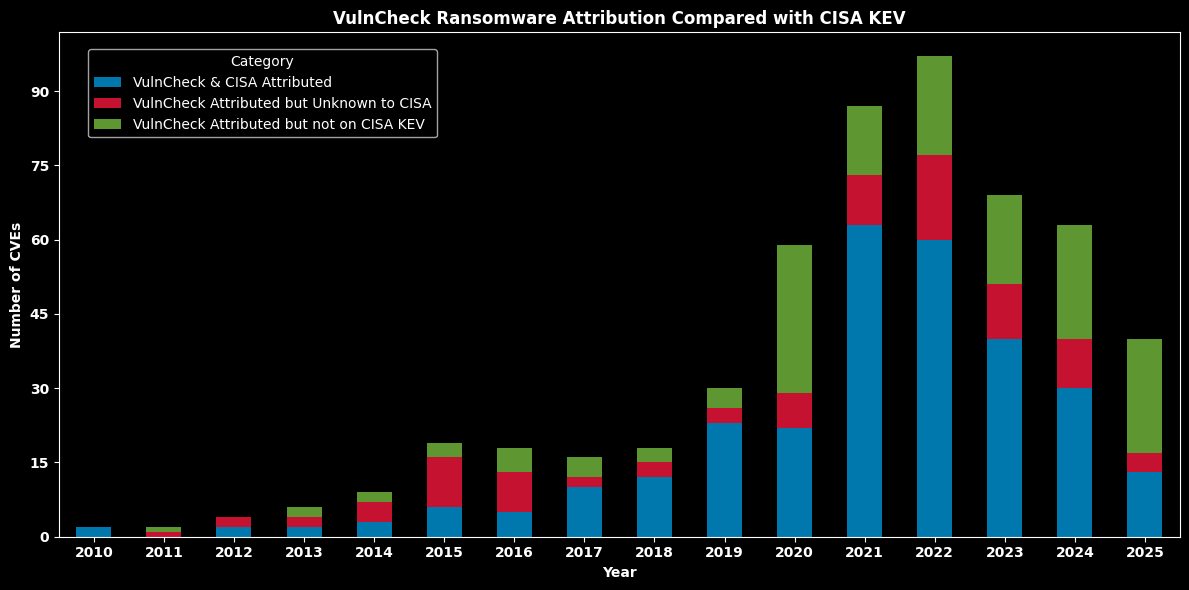
ax.set_title("VulnCheck Ransomware Attribution Compared with CISA KEV", fontweight="bold")
ax.set_xlabel("Year", fontweight="bold")
ax.set_ylabel("Number of CVEs", fontweight="bold")
# X ticks: set locations to exact bar positions and labels to 4-digit years (horizontal, bold)
positions = np.arange(len(counts.index))
ax.set_xticks(positions, labels=[str(int(y)) for y in counts.index], rotation=0, fontweight="bold")
# Y ticks: integer locator + formatter; make tick labels bold without replacing the locator
ax.yaxis.set_major_locator(MaxNLocator(integer=True))
ax.yaxis.set_major_formatter(FuncFormatter(lambda v, pos: f"{int(v):d}"))
for tick in ax.yaxis.get_major_ticks():
tick.label1.set_fontweight("bold")
# Legend inside top-left (keep your long labels)
ax.legend(
title="Category",
labels=[
"VulnCheck & CISA Attributed", # Known
"VulnCheck Attributed but Unknown to CISA", # Unknown
"VulnCheck Attributed but not on CISA KEV", # Unspecified
],
loc="upper left",
bbox_to_anchor=(0.02, 0.98),
frameon=True,
)
plt.tight_layout()
plt.show()